Welcome to the SoGA Health in Cities Interactive Website guide! The objectives of this guide are to provide instructions for:
- Creating Comparative Air Quality or Health Impact Plots
- Downloading Plot Images and Data
- Exploring and Downloading Air Quality and Health Impact Data Tables
Part 1: Create Comparative Air Quality or Health Impact Plots
- Select either the ‘Air Quality’ or ‘Health Impact’ tab. By default, the ‘Air Quality’ tab will be selected. When a tab is selected, the text color will be white and the tab will be dark blue.
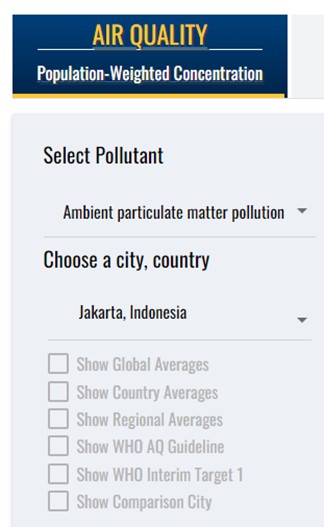
- Use the menu on the left side of the screen to define the parameters of your search. Parameters for the air quality plot include pollutants and city. The health impact parameters include city and the additional category ‘metric’ which is explained further in our glossary.
(By default, the selected city is Jakarta, Indonesia. To change the selected city, you can either type in the full name of the desired city or type in the first alphabet of the city name and then scroll through the alphabetized list.) - To view a specific pollutant, use the ‘select pollutant’ drop-down menu. This will allow you to choose from one of two pollutants: ambient particulate matter and nitrogen dioxide. For health burden, there is only one pollutant category, ‘ambient particulate matter’.
- You may compare the selected city to other cities by clicking on the ‘Show Comparison City’ box at the bottom of the left-hand-side menu. Once selected, the box and text will be highlighted in gold. The default city is Tokyo, Japan. The comparison city can be changed by either typing the city of interest or by typing the first letter of the desired city and scrolling through the alphabetized list.
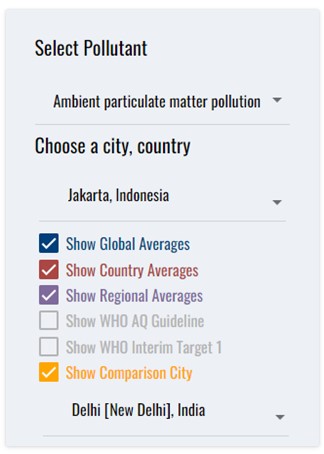
- To compare the estimates of a selected city to global, regional, or country estimates, click the associated checkbox at the bottom of the left-hand menu. Once selected, the box, associated text, and associated line will be highlighted blue, red, or purple.
- To compare the air pollution level of a selected city with the WHO air quality guidelines and WHO interim target 1, you can select the ‘Show AQ Guideline’ and the ‘Show WHO Interim
Target 1” checkboxes at the bottom of the left-hand menu. - If you are interested in specific data points, you can click on the plotted dots to view specific numerical data.
Part 2: Downloading Plot Images and Data
There are several ways to download both the plots and the data you worked with in Part 1. The following steps will assist you in obtaining these downloads.
- To download the image of a plot, select the black arrow on the top right side of the plot.
- Select the image download type of your choice. Options include PNG image and JPEG image.
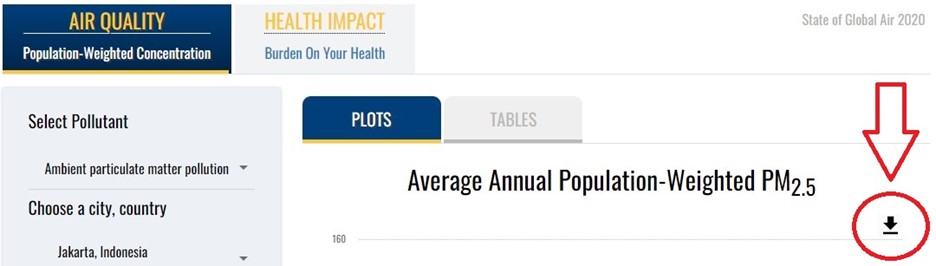
- If you are interested in downloading the raw data you see on the plot, select the arrow, and then click ‘Download CSV’.
Part 3: Explore and Download Air Quality and Health Impact Data Tables
All the data used to create the line plots are available to search, sort, and download from the site. The tables include data for all years (2000-2019). In addition, the tables include 95% upper and lower uncertainty intervals for the total number of deaths attributable to PM2.5 listed in under the Health Impact tab.
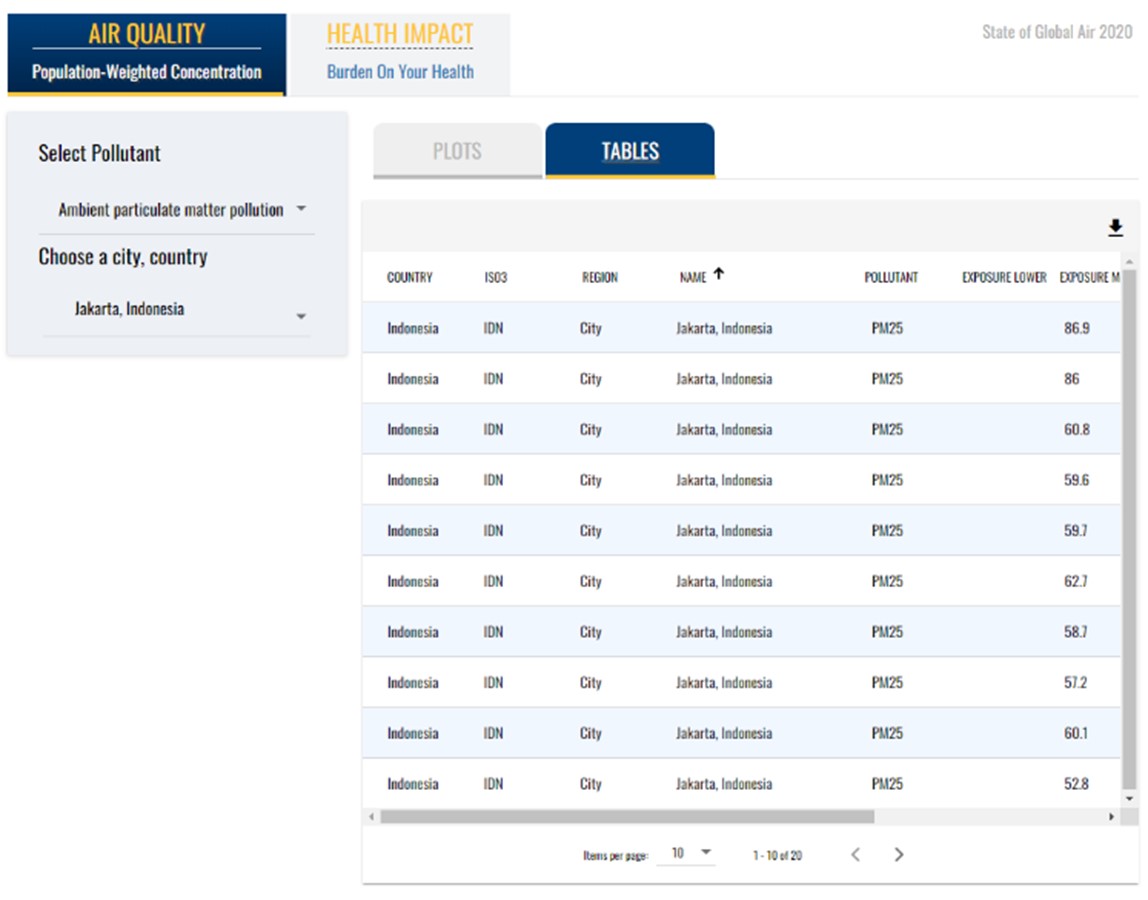
- When the site opens, it is set to ‘Plots’ by default. Switch to tables by selecting ‘Tables’ from the tabbed menu above the plots. The ‘Tables’ tab will then be highlighted in dark blue with white text.
- To create a table with air quality data or health impact data, set all parameters as you would for creating the plots (Part 1). The table will display the data based on the parameters that are selected starting with the first year of data collection (2000). You can use the arrows at the top of each column to sort the data.
- To download created tables as a csv, select the black arrow on the top right side of the plot and click ‘Download as CSV’.
Download these instructions as a PDF:
