Particulate matter concentrations are measured in micrograms of particulate matter per cubic meter of air, or µg/m3. Ground monitoring of air quality remains limited in many regions of the world, particularly in low- and middle-income countries. To fill the data gaps and to provide a consistent view of air pollution levels in cities around the world, researchers combine data from different sources including ground monitoring and satellite data.
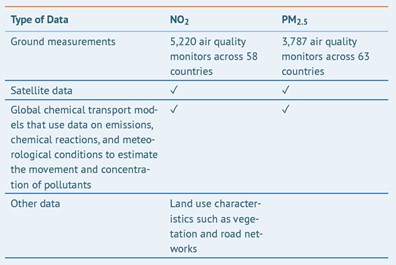
The scientific team systematically estimated annual average concentrations of PM2.5 and NO2 across the entire globe, which was divided into grid cells each covering 0.0083° × 0.0083° of longitude and latitude (approximately 1 × 1 kilometers at the equator). They then used information from all grid cells within a city boundary to estimate the PM2.5 concentration in a specific city.
To estimate the annual average PM2.5 and NO2 exposures (that is, the concentrations that a population in a specific city is more likely to be exposed to in one year) the team linked the concentrations in each grid cell with the number of people living within each block to produce a population-weighted annual average concentration. Population-weighted annual average concentrations are better estimates of population exposures than, for example, simple averages across monitors, because they give greater weight to the pollutant concentrations experienced where most people live.
Because these population-weighted air pollutant concentrations represent annual averages across an entire city, they include, but do not represent, the considerably higher concentrations that may be observed day to day or in certain seasons, especially around major pollution sources. Satellite-derived data are more reliable in estimating long-term than short-term trends. Although short-term exposure spikes can affect health, it is long-term exposures that contribute most to the burden of disease and mortality from air pollution and therefore are the focus of this report.
How Accurate Are These Estimates?
Extensive comparisons between these satellite-derived estimates and ground-level measurements demonstrate that they are reasonably accurate. They can be reliable indicators of PM2.5 and NO2 exposures where ground monitors do not exist or data are not publicly available.
However, it is important to note that the accuracy and certainty of the exposure estimates vary by region. Since ground measurements are incorporated in the model, estimates are less reliable for regions with fewer or no air monitoring stations (e.g., cities in Africa and Asia). In addition, estimates for coastal cities and cities with persistent snow or cloud cover also have higher uncertainty due to limited satellite coverage. Over time, more systematic and detailed data on emissions and traffic at the city level, as well as ground-level air quality data, can help improve the accuracy of the estimates.
How Burden of Disease Is Estimated
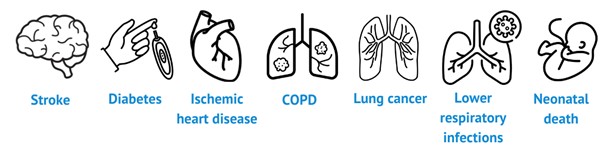
The scientific team calculated the health burden associated with PM2.5 exposures in cities using a rigorous method in line with the 2019 Global Burden of Disease study. Deaths from six diseases were included to estimate the burden on health associated with PM2.5: ischemic heart disease, stroke, lower respiratory infections, lung cancer, type 2 diabetes, and chronic obstructive pulmonary disease (COPD). Of note, impacts on infant health were not estimated in this analysis.
To calculate PM2.5-associated burden of disease in each city, the team combined the following:
- Mathematical functions, derived from epidemiological studies, that relate different levels of PM2.5 to the increased risk of death from each cause, by age and sex, where applicable
- Estimates of population exposure to PM2.5
- Country-specific data on underlying rates of disease and death for each pollution-linked disease (as city level data are not available for the majority of cities)
- Population size and demographic data
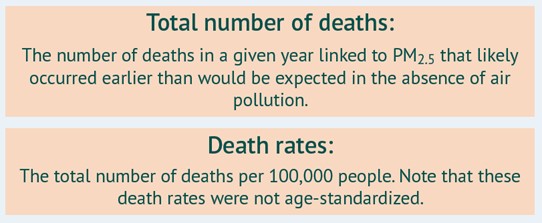
The results of these calculations are expressed for the population in every city in two ways:
Estimates of scientific uncertainty are provided for every value in the form of 95% uncertainty intervals (UIs), representing the range between the 2.5th and 97.5th percentiles of the distribution of estimated values.
How Can the Burden Estimates Be Improved?
The burden estimates can be improved further as more city-level data become available. For this analysis, national baseline disease rates were used as a proxy for cities of a specific country because city-level data is mostly not available. The country-level age distributions were also applied to cities directly. However, cities may have disease patterns and demographic profiles that are different from the national averages. Although comparisons have shown that estimates using country-level and city-level data are broadly in line with each other, using city-level disease rates and demographic data can certainly enhance the results. Moreover, fine particle pollution affects human health beyond deaths. Including data on other mortality and morbidity outcomes, such as neonatal health outcomes and childhood asthma, can lead to more representative estimates.
